Introduction
Cacti has a great polling engine for retrieving SNMP, WMI and other data from a lot of different devices. It generally stores the data into RRD files which are then being used to create the actual graphs for the users to view. By using InfluxDB together with Grafana as a frontend, it is possible to built an easy to use performent dashboard for end-users utilizing the Cacti polling engine.
While this is great for monitoring and troubleshooting purposes, it lacks the ability to use the data for further analysis.
Exporting the data from the poller into a database like InfluxDB overcomes this limitation and allows users to work with the data to create their own reports and analysis.
Why using InfluxDB as a target for Cacti data ?
Cacti is polling a lot of data in a 5 minute or even 1 minute polling interval. The data consists of single data points like CPU load or inbound interface traffic counters. Storing these into a normal database lets the tables grow very fast when no aggregation is being used. This is also the reason why Cacti uses RRD files to store the data, as RRD automatically takes care of the aggregation part.
InfluxDB is similiar to RRD as it has
- Builtin retention policies
- Aggregation on the fly capabilities
- Capabable of storing millions of datapoints
- Can be distributed to different systems
- And has an SQL like interface
All of these features makes it the perfect candidate for storing Cacti data.
How to transfer data from Cacti to InfluxDB ?
Cacti has a very good plugin architecture allowing the creation of plugins which are capable of working with the freshly polled data. This allows us to create a plugin which takes the polled data and stores it into a temporary table for further processing. The reason why we do not want to directly take the polled data and send it off to InfluxDB is the performance impact for retrieving and sending single data items from Cacti to InfluxDB.
Once the temporary tables is filled with all the polled data, the plugin then goes and groups the data by the actual polled hosts. It then creates data objects with all the data from each host and sends it off to InfluxDB using the http API. Sending multiple data points at once increases the speed and performance of the export into InfluxDB dramatically, leaving a very low impact on the Cacti polling cycle.
The plugin being used for this purpose is called CereusTransporter, which is available from this site.
How can we visualize the data now ?
There are several programs available for doing the actual visualization of InfluxDB data. One of these is called Grafana whch provides an easy to use interface for creating Graphs and visualizing InfluxDB data.
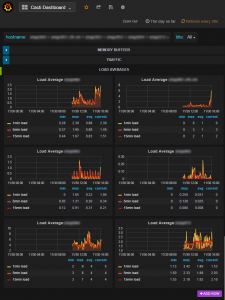
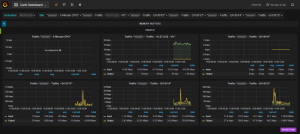
Grafana Images
5 thoughts on “Visualizing Cacti Data with Grafana and InfluxDB”
Leave a Reply
You must be logged in to post a comment.


Hi, do you have some example queries from your dashboard? I can’t seem to get mine to work. I tried a lot of different queries, even a nudge in the right direction would be greatly appreciated. Thank you in advance.
Hi, Checkout the page from Lindsay Hill: https://lkhill.com/using-influxdb-grafana-to-display-network-statistics/ There’s a section on there which describes the building of the traffic charts. I’ve used that for building the queries.
hello
the plugin is really great. it works very well with cacti.
I would like to adapt the plugin to other rrd databases not generated by cacti. is it possible, with little modification of the plugin ?
i would like to use it especially for pnp4nagios, which generate also rrd databases.
Thanks for your answer.
Noruni
Hi Noruni James
Unfortunately, the plugin is actually not using the rrd files at all, but makes use of the fact that Cacti stores the polled data into a specific table within the cacti database before writing it into the rrd files.
Hi
So can you explain and tell me wich table then, I’ll try to adapt the script to collect data?
Thanks
Noruni