Welcome to this little HowTo on setting up an InfluxDB Datasource for Grafana. If you have followed the other guides on setting up influxdb and installing Grafana on Centos then you should be able to follow this little guide with ease.
HowTo – Setup InfluxDB Datasource in Grafana
We’re first going to clarify some requirements for being able to setup InfluxDB as a datasource. InfluxDB has the ability to enable user authentication for accessing the database ( look here for details ). For this HowTo we are going to assume that we did not setup user authentication and also have InfluxDB installed on the very same server as Grafana so we are using a CentOs 7 system.
InfluxDB Preparation
The following configuration should be set in your /etc/influxdb/influxdb.conf file:
[http]
 enabled = true
 bind-address = ":8086"
 auth-enabled = false
 log-enabled = true
 write-tracing = false
 pprof-enabled = false
 https-enabled = false
 https-certificate = "/etc/ssl/influxdb.pem"
 max-row-limit = 10000
This will allow to connect to your InfluxDB without authentication using the http protocol.
Grafana Configuration
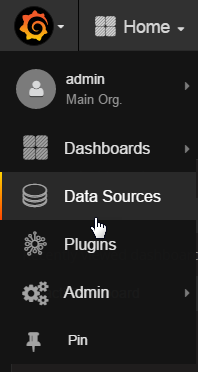
Once you have logged into Grafana, go to the main menu and hit the “Data Sources” entry:
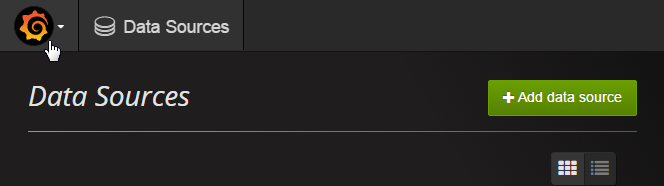
You should now see an empty screen with no data sources defined. Now hit the “+ Add data source” button to the top right of that screen:
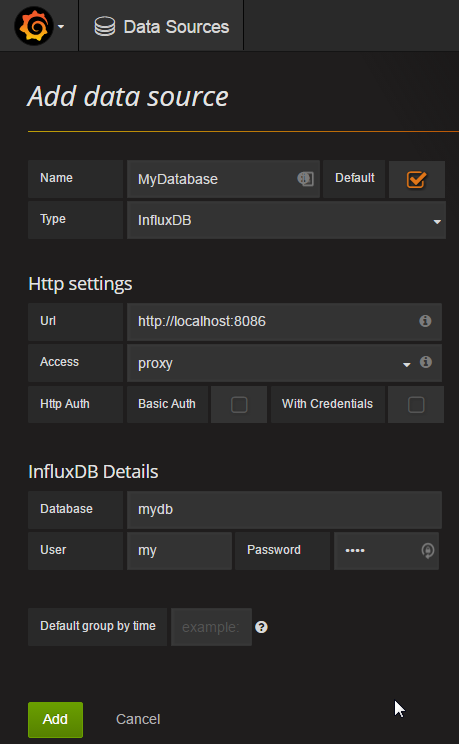
You should be able to define your data source now. As we are going to setup InfluxDB as the source, select “InfluxDB” from the “Type” drop-down box and enter the data as seen on the following screen. Use “my” as the username and “mydb” as password. Both are required for Grafana to save the data source, but are not going to be used to connect to your influxdb database:
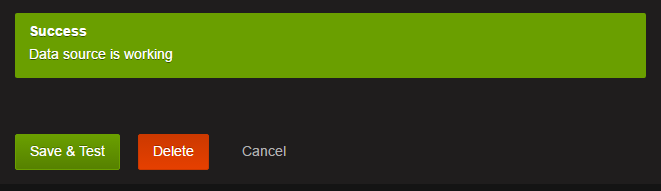
Once you hit the “Add” button, you should see the following message appear:
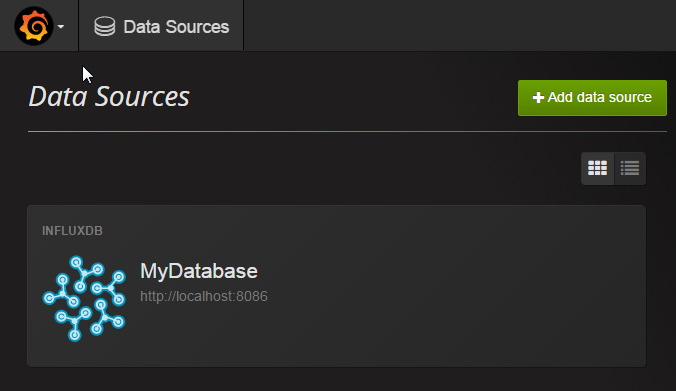
Click on the “Data Sources” on the top and you should see your new entry appear:
Now you can continue with setting up your Dashboard !