
Aus dem Feuerwehr-Fachjournal: die digitale Übungsauswertung
Im Feuerwehr Fachjournal, das am 27. November 2026 erscheint, beschreibt Axel Manz die digitale Übungsauswertung beim Leistungsabzeichen. Die Handy-Anwendung aus dem Artikel ist die Übungsdokumentation SRHT aus FW Tools. Sie steht jeder Feuerwehr und jedem Ausbilder schon heute zur Verfügung.
Was die Anwendung an der Station kann
- Zeitmarken auf Knopfdruck: Nach dem Start der Übung setzt der Stationsbetreuer vordefinierte Marken wie „Person gefunden“ oder „Person gerettet“. Jede Marke hält die Zeit ab Übungsbeginn fest.
- Fotos und Anmerkungen: Positives und Kritisches wird direkt mit dem Handy fotografiert und landet an der richtigen Stelle im Zeitstrahl.
- Safety-Check als Time-out: Eine gezielte Unterbrechung für die Sicherheitsprüfung wird nicht auf die Gesamtzeit angerechnet.
- Übungsbericht sofort: Nach der Station bekommt das Team einen Bericht mit Zeitmarken, Bildern und Anmerkungen als PDF. Der nächste Durchgang beginnt mit denselben Marken.
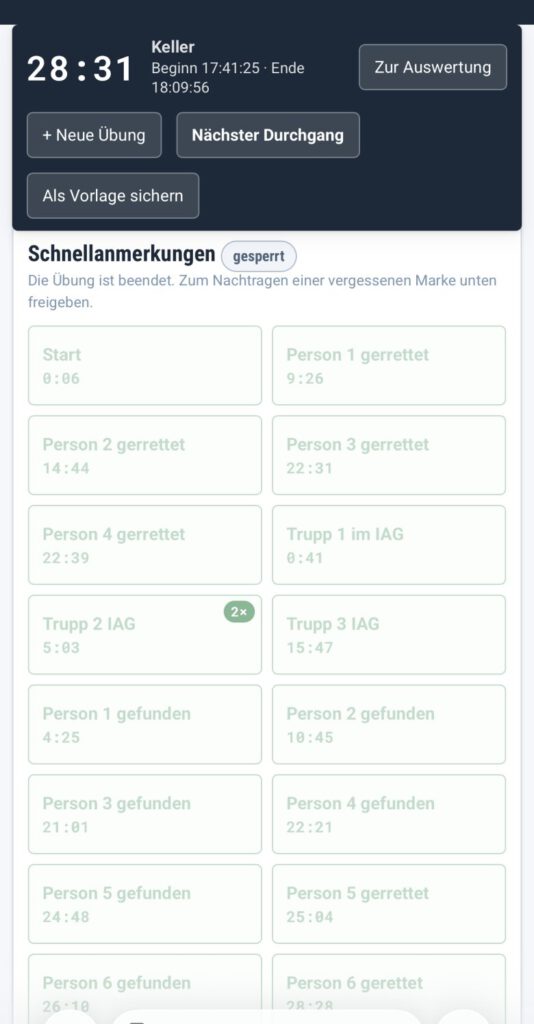
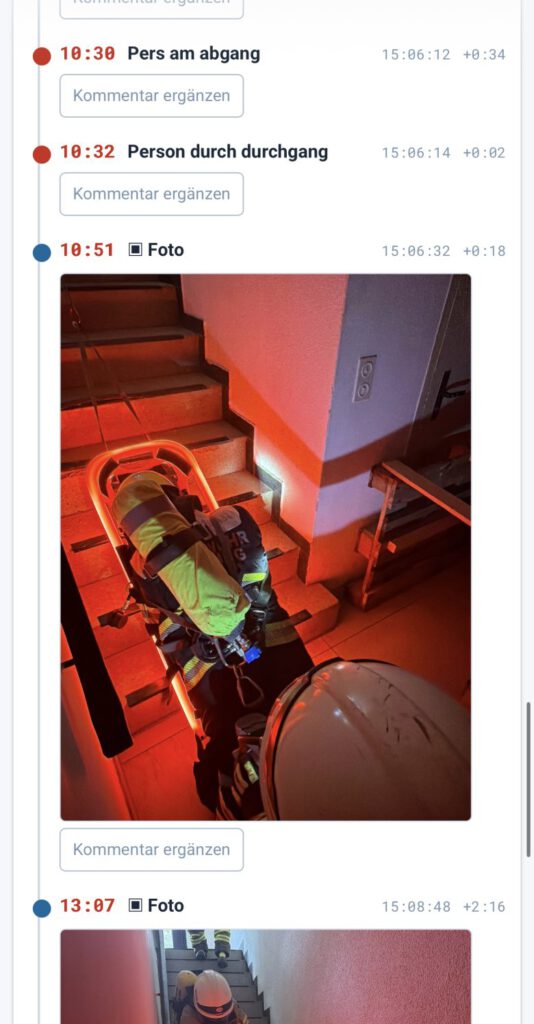
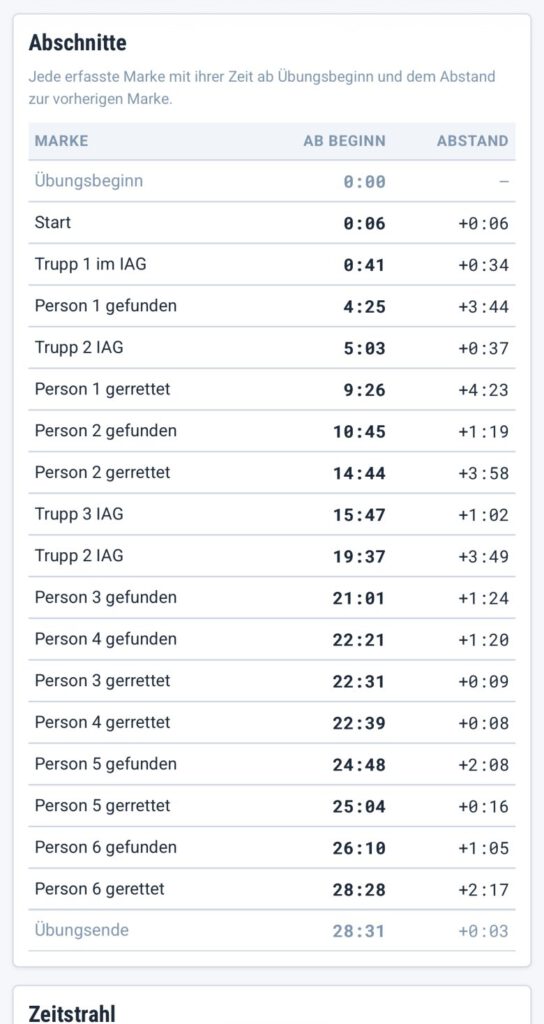
Aus einer echten Übung: Zeitmarken, Foto im Zeitstrahl und Auswertung.
Ohne Anmeldung, auch ohne Netz
Die Übungsdokumentation läuft im Browser des Handys, es muss nichts aus einem App-Store installiert werden. Einmal geöffnet, funktioniert sie auch im Keller oder im Schacht, wo kein Netz ist. Die Daten liegen auf dem Gerät; nur für den PDF-Bericht gehen sie einmal an unseren Server und werden dort nicht gespeichert. Namen sind nicht nötig.
Ausprobieren und freischalten
Die Anwendung lässt sich ohne Schlüssel ausprobieren. Für den PDF-Bericht gibt es auf Anfrage einen Probeschlüssel für 60 Tage. Die Ausbilder-Lizenz für 199 € im Jahr schaltet den unterschriftsreifen Bericht frei, und zwar für die Übungsdokumentation SRHT und den Leistungsnachweis zusammen und für die ganze Ausbildergruppe.
FW Tools ist ein unabhängiges Produkt von Urban-Software.de. Entwickelt wurde die Übungsdokumentation SRHT gemeinsam mit Axel Manz.

Neu: Software für die Feuerwehr
FeuerwehrLERN und FW Tools: eine Lern-App für Feuerwehrleute und Browser-Werkzeuge für den Übungsdienst. Beide Produkte haben jetzt eine eigene Seite.Read More
Cereus Insights 2.0: Threshold Suggestions, Multi-Provider LLM, and Smarter Forecasting
Cereus Insights for Cacti has received a significant update. The release introduces a new Threshold Suggestions engine, expands LLM support to three providers, and tightens how the system handles inverted metrics like free memory and available disk space. Here is what is new.
Threshold Suggestions (Professional+)
The most visible addition in this release is the Threshold Suggestions page. Many Cacti installations have hundreds of datasources with no Thold thresholds configured — not because operators don’t want alerting, but because setting thresholds manually across a large environment is time-consuming and requires knowing what “normal” looks like for each metric.
Cereus Insights now analyses the baseline data it already computes for anomaly detection and derives a recommended thold_hi or thold_low value for every unconfigured datasource. Each suggestion comes with a confidence score: the percentage of the 168 hour-by-day-of-week time buckets that have sufficient history. A score of 100% means the system has seen the metric at every hour of every weekday for the full baseline window — the suggestion is grounded in complete data.
Direction is handled automatically. Datasource names containing “free”, “avail”, or “idle” receive a thold_low suggestion and will alert when the value drops below the threshold, not above it. All other datasources receive a thold_hi suggestion. One-click Create applies the value to Thold directly. Skip dismisses a row permanently without affecting other analysis. The Exclude DS Name control adds a datasource name to a global exclusion list that suppresses it across suggestions, anomaly detection, and forecasting simultaneously.
Enterprise-tier users also get an Explain button that sends the baseline data to the configured LLM and returns a plain-English description of why that threshold value was chosen.
Multi-Provider LLM Support (Enterprise)
The LLM alert summarization feature previously required an Anthropic API key. It now supports three providers: Anthropic (Claude), OpenAI (GPT), and Google (Gemini). A Provider dropdown in the Settings tab controls which provider is active. The “Test API Key” button validates the key against the selected provider before it is saved, so misconfigured keys are caught immediately rather than at the next alert batch.
The LLM API Key label in Settings has been updated accordingly — it is no longer labelled as a Claude-specific key.
Forecast Direction Awareness (Community+)
Capacity Forecasting now distinguishes between metrics that grow toward a ceiling and metrics that drain toward a floor. For datasources whose names contain “free”, “avail”, or “idle”, the forecast targets thold_low instead of thold_hi and only projects a saturation date when the slope is negative — when the value is actively declining. Growing free space generates a “Never / Stable” result rather than a spurious future date.
This eliminates a category of false urgency that appeared on disk-free and memory-available datasources in previous versions.
Other Changes
The global datasource exclusion list, managed from the Threshold Suggestions page, also reduces baseline computation and forecast work. Adding a noisy datasource name to the list removes it from every processing pass, which is useful for constant-value counters or metrics with frequent resets.
The Status box now shows four panels: Anomaly Baselines (detection readiness percentage, average samples per bucket), Capacity Forecasts (quality percentage, average R²), Threshold Suggestions (eligible count, high-confidence count), and AI Summaries. During an active batch pass the panels display an in-progress indicator rather than a static countdown.
Batch size defaults to 500 and forecast recomputation runs every hour.
Availability
Cereus Insights requires Cacti 1.2.x or later. Threshold Suggestions and Anomaly Detection require a Professional license. LLM Summarization and the Explain button require an Enterprise license. Capacity Forecasting is available on all tiers.
Licenses and plugin downloads are available at urban-software.com
Automating Network Infrastructure: Seamless Synchronization Between SolarWinds and Cacti
Automating Network Infrastructure: Seamless Synchronization Between SolarWinds and Cacti
In today’s complex network environments, maintaining accurate device inventories across multiple monitoring platforms is a challenge that every network operations team faces. When your organization relies on both SolarWinds for comprehensive network discovery and Cacti for performance monitoring, keeping these systems synchronized can become a time-consuming manual process fraught with errors.
We developed an automated solution that bridges this gap, creating a seamless synchronization workflow between SolarWinds device exports and Cacti’s monitoring infrastructure.
The Challenge
Network teams typically face several pain points when managing multiple monitoring platforms:
- Manual device synchronization between systems leads to inconsistencies
- Outdated device inventories create monitoring blind spots
- Time-consuming administrative tasks pull engineers away from strategic work
- Lack of hierarchical organization makes it difficult to navigate large device lists
- Redundant configuration increases the risk of errors
Our Solution: Intelligent Automation
Our automation framework tackles these challenges head-on with a comprehensive approach:
1. Smart Device Discovery & Synchronization
The system automatically processes SolarWinds device exports (Excel format) and intelligently compares them against Cacti’s existing inventory. It identifies:
- New devices that need to be added to Cacti
- Removed devices that should be flagged for deletion
- Changed configurations that require updates
2. Intelligent Device Filtering
Not every device deserves equal attention. Our solution includes sophisticated filtering logic:
- Device function-based selection focuses on routers, switches, firewalls, and critical infrastructure
- WAN interface detection for Layer 2 switches ensures only edge devices with WAN connectivity are monitored
3. Hierarchical Organization
The automation creates a logical, navigable structure:
- Region → Country → Site hierarchy in Cacti’s device organization
- Automatic site creation with timezone detection based on country
- Graph tree automation that organizes WAN interface graphs by geographic location
4. Graceful Device Lifecycle Management
Rather than immediately deleting devices, our system implements a staged approach:
- Devices missing from SolarWinds exports are tagged as [TO BE DELETED]
- A configurable grace period allows for verification before permanent removal
- Detailed audit trails track when and why devices were flagged
5. Targeted Graph Automation
The system automatically creates automation rules that:
- Focus specifically on WAN interface graphs
- Organize graphs hierarchically by Region/Country/Site
- Use site codes extracted from device hostnames for intelligent matching
Key Benefits
Organizations implementing this automation experience:
- 90% reduction in manual device management time
- Consistent inventory across monitoring platforms
- Faster onboarding of new network devices
- Improved visibility through organized hierarchical views
- Reduced monitoring gaps from outdated inventories
Technical Highlights
Our solution leverages:
- Cacti’s native API for seamless integration
- PHPSpreadsheet for robust Excel file processing
- SNMP polling for real-time device validation
- Intelligent pattern matching for device and site identification
- Database-driven automation for reliable operation
Real-World Impact
For organizations managing hundreds or thousands of network devices across multiple regions, this automation transforms network monitoring from a reactive, manual process into a proactive, automated workflow. Network engineers can focus on analysis and optimization rather than administrative tasks.
The system runs automatically on schedule (via cron), continuously ensuring that your Cacti monitoring infrastructure accurately reflects your SolarWinds device inventory.
Looking Forward
As network infrastructures continue to grow in complexity, automation isn’t just a nice-to-have—it’s essential. By bridging the gap between discovery platforms like SolarWinds and monitoring systems like Cacti, organizations can maintain accurate, up-to-date visibility into their network infrastructure without drowning in administrative overhead.
Ready to automate your network monitoring workflow? This solution demonstrates how intelligent automation can transform network operations, freeing your team to focus on what really matters: keeping your network running at peak performance.
CereusTransporter Plugin Now Supports Elasticsearch 8 and Elastic Cloud 8!
🌟 Exciting Update: CereusTransporter Plugin Now Supports Elasticsearch 8 and Elastic Cloud 8! 🌟
Calling all Cacti users! We’re thrilled to announce an important update to the already amazing #CereusTransporter plugin! 🌵🚀
You’ve experienced how effortlessly CereusTransporter sends your Cacti data to popular tools like #Boson and #InfluxDB. We’ve expanded its functionality to support #Elasticsearch and #ElasticCloud! This update will elevate your data analytics and monitoring capabilities to new heights.
🔗 CereusTransporter Enhanced Features:
1️⃣ Expanded Compatibility: Besides Boson and InfluxDB, CereusTransporter now seamlessly integrates with Elasticsearch and Elastic Cloud, ensuring smooth data transfer and integration.
2️⃣ Improved Analytics: With Elasticsearch and Elastic Cloud support, you can unlock even more potential from your Cacti data by leveraging advanced analytics and visualization features.
📣 Calling Testers: We’re looking for enthusiastic testers to help us ensure that the new features of CereusTransporter work flawlessly! If you’re a Cacti user eager to contribute to the plugin’s development, join our test group and enjoy early access to the enhanced features while sharing your valuable feedback.
🔗 Connect with us on LinkedId and get in touch to join our test group or to learn more about the updated CereusTransporter plugin!
Release of Cacti version 1.2.24
🚀The latest release of Cacti, version 1.2.24, comes with numerous improvements, bug fixes, and compatibility enhancements.
Here are some key highlights:
🔧 Fixes in template import, device management, and database operations.
🌐 Compatibility updates for PHP 8.2, Debian ‘bookworm’ systems, and various themes.
🛠️ Enhancements to SNMP settings, plugin permissions, and remote data collectors.
🌟 Improved user experience, including better translation handling, error logging, and interface updates.
This update addresses a wide range of issues, from template handling to database management, ensuring a more stable and efficient monitoring environment. By upgrading to Cacti 1.2.24, users can enjoy a smoother and more reliable experience, benefiting from the numerous fixes and improvements in this release.
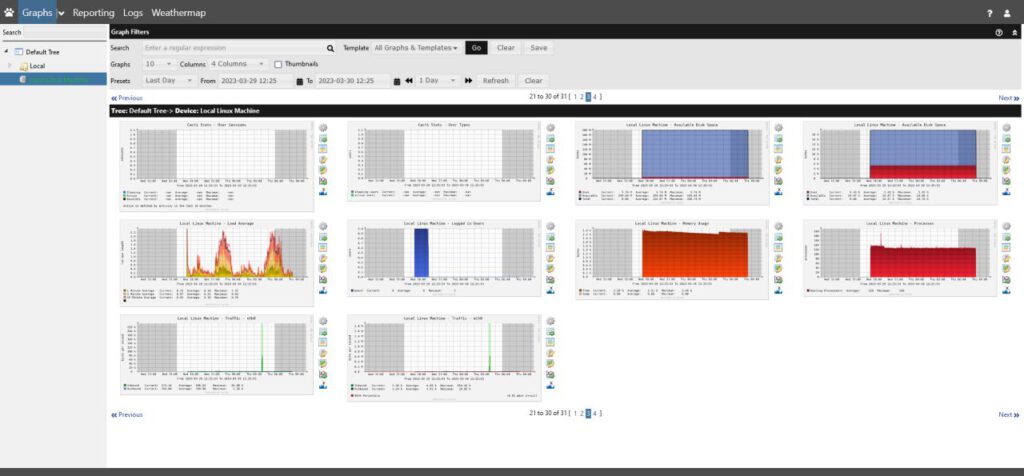
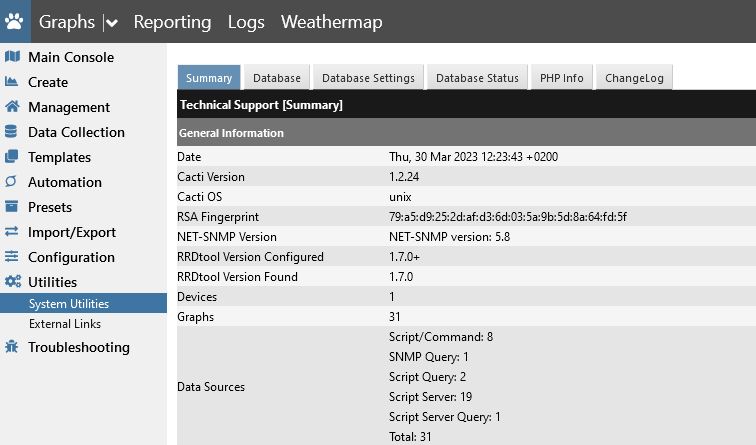
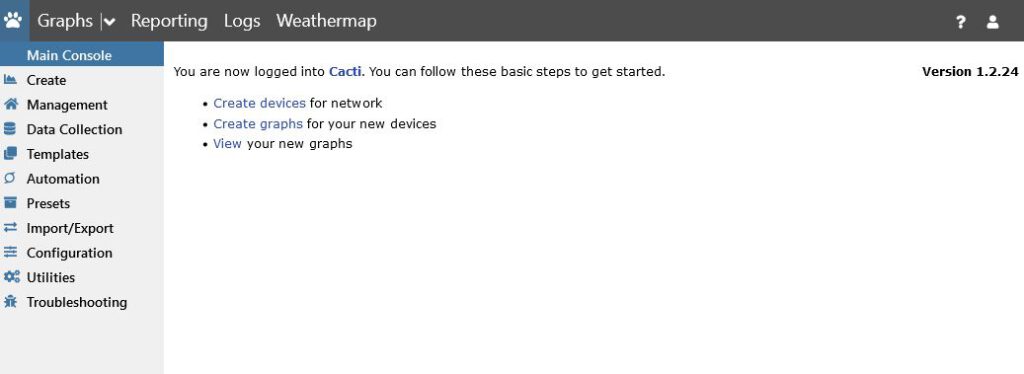
Make sure to update your Cacti installation and take advantage of these enhancements! 🎉
Visit the Cacti site and download the latest copy: https://www.cacti.net/
Make sure to contact us for your support requirements !

CereusTransporter 1.0 has been released!
Exciting news for all Cacti users!
I am thrilled to announce the release of the CereusTransporter 1.0 plugin for Cacti. This powerful plugin lets you easily send data from Cacti to InfluxDB2 for advanced monitoring and analysis.
With CereusTransporter, you can easily monitor and analyze data from multiple sources in near real-time, giving you a complete picture of your network performance.
Built Dashboards in Grafana, or use Machine Language to identify issues before they occur.
If you need support or have any questions about the CereusTransporter plugin, please contact us.
Download the plugin today and take your network monitoring to the next level!
CereusTransporter for Cacti supports InfluxDB2
CereusTransporter for Cacti now supports InfluxDB2 and token-based authentication. Data from Cacti can now be sent to InfluxDB2, a time series platform where you can collect and store long-term data from multiple sources.
CereusTransporter is a plugin for Cacti that can send data to databases or platforms like Bosun, InfluxDB1/InfluxDB2, or OpenTSDB. The Cacti data then can be further processed to create Dashboards, integrated into existing alarm tools, or just kept for BigData analysis.
The upcoming release of CereusTransporter 1.x will add InfluxDB2 support. Future versions add the ability to define custom tags, filter data to be sent, and specify multiple target platforms.
Look here for the plugin page: CereusTransporter
If you need commercial support with your Cacti installation, Contact us today !
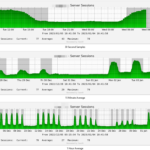
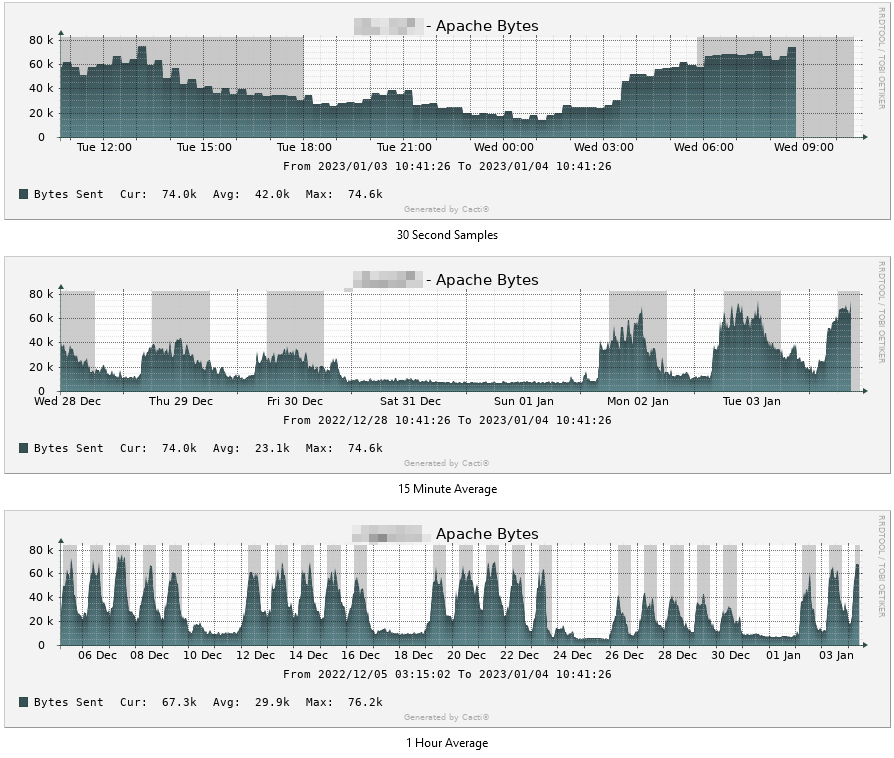
Identify issues with new features in Cacti 1.2.23!
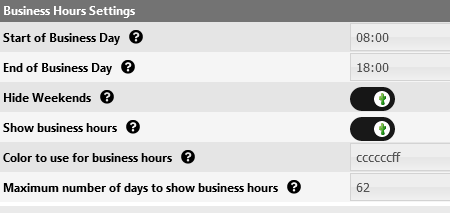
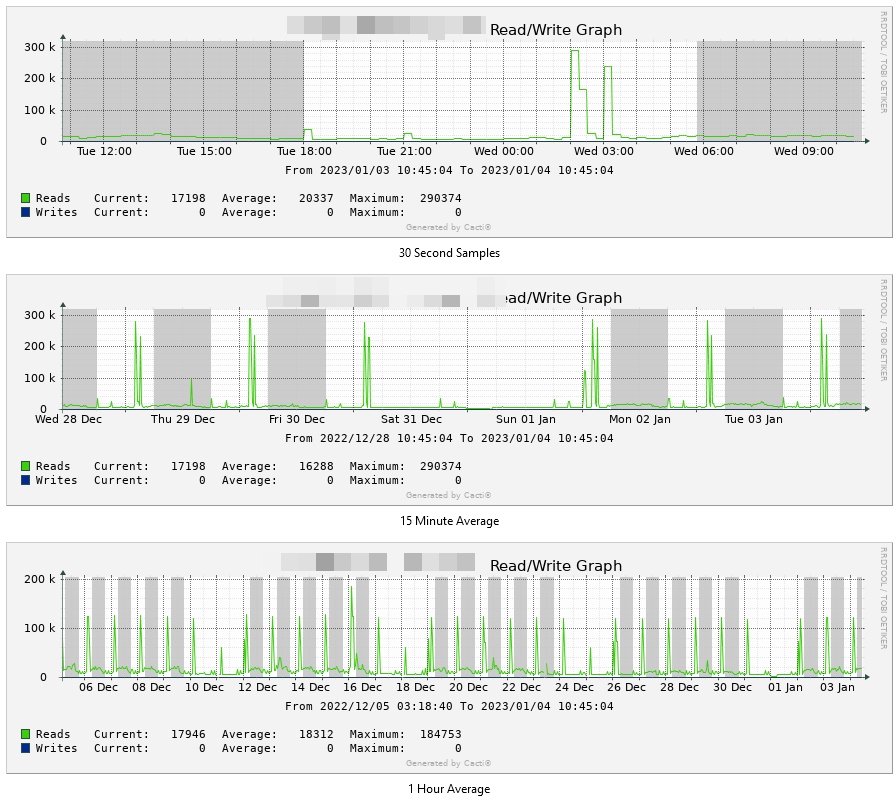
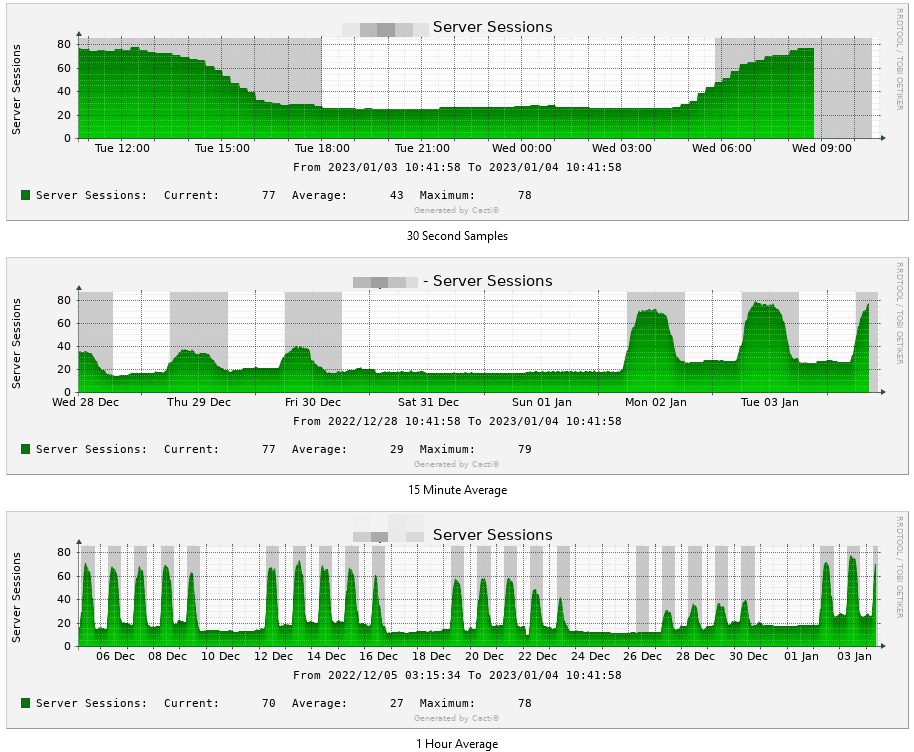
The new version of Cacti now includes the ability to highlight Business Hours within the graphs. You can set the start and end times for your business hours. Cacti will automatically add a background in the color you set so you can easily identify traffic, CPU load, or other data happening during working time or outside of your business hours.
Using this feature, it’s easy to identify issues that happened outside of normal hours, like unusual data flow, high CPU load peaks, or increased response times of your webservers.
The Screenshots below demonstrate this new feature. You can enable this in the Visual tab in your Cacti settings!
New InfluxDB2 HowTo
I have updated my HowTo install InfluxDB guide to use influxDB 2 on Rocky Linux 8 and added a section for creating an API Token.
The CereusTransporter plugin for Cacti will be updated shortly to support this token-based access to InlfuxDB so you can analyze your Cacti data within InfluxDB. By using this plugin, you can visualize Cacti data using Grafana.