Cacti 1.2.22 Patch for CVE-2022-46169
The patch below imlements a fix to resolve CVE-2022-46169.Contact me for other backports of the fix.
cacti-patch-1.2.22-CVE-2022-46169.zip – Download (936)
Cacti on Google Cloud Platform
A typical Cacti installation is built on a single physical or virtual host that holds the file storage, database and also provides the web-interface. When not using the remote poller feature, the polling of data is also being conducted on the same server.
Cloud platforms like AWS, Azure or GCP enables a more horizontally scalable implementation of the Cacti system.
During the following weeks, we will explore the different options on running Cacti on the Google Cloud Platform and provide some HowTo sections on getting your Cacti instance running within the GCP environment.

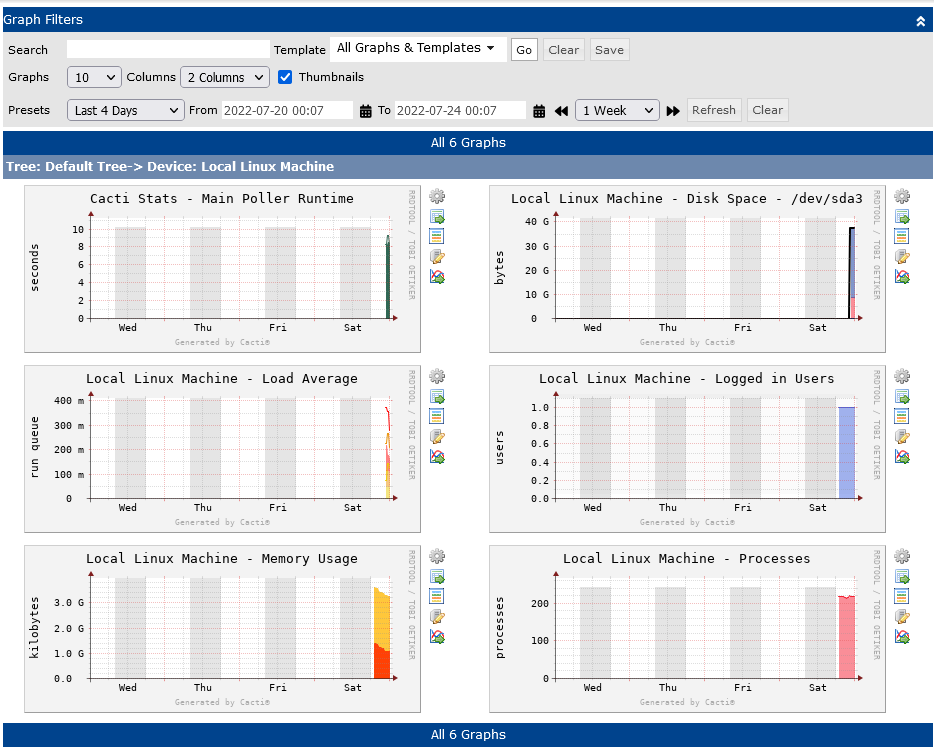
Gaps in Cactis Graphs
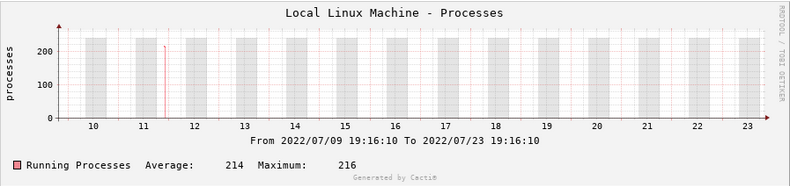
Everyone has seen these gaps in the Cacti graphs, and it’s one of the customers’ most significant concerns. They can have numberous causes, from performance issues on the Cacti server, to network outtages or security enhancements.
One cause of these gaps may not be that obvious though. Let’s look at the following example for an unusual issue:
I’ve seen 2 WAN devices with identical hardware on a remote site. However, one of them had no gaps; the other device had many gaps.
The system uses the spine as the poller with a 1-minute interval. The maximum polling time is around 25-30 seconds, so way below the 60 seconds limit.
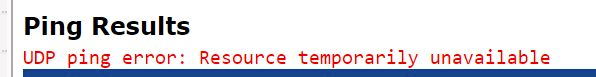
Looking into the issue, one could see that one of these devices had an availability of 70% (check the Management->Devices page), while the other was close to 100%. Looking further, the UDP ping was returning a “Resource temporarily unavailable.” Switching to ICMP, it was immediately available.
Now, as Cacti doesn’t poll the device when it is down, that UDP issue caused Cacti to have many gaps in the graphs. Switching to “ICMP” or using “SNMP Uptime” stopped these gaps from appearing.
If you require help with your Cacti installation, feel free to get in contact with us !
Cereus BusinessHours for Cacti
Urban-Software.com is currently working on a new feature to enable business hours support for Cacti. You will be able to see business hours highlighted on the Cacti charts. The new feature will be released as a plugin first named Cereus BusinessHours.
Cereus BusinessHours will allow users to define the start/end of normal business hours, exclude/include weekends and set special holidays.
The basis of the plugin will enable more features to be shown, like planned down-times, or times of known issues.
The plugin fully supports STACK, AREA and LINE graphs. Thumbnails also show the business hours for cacti area. Reports based on the rrd graphs as well as Realtime charts include this feature.
Contact us if you want to get more information and also like to see business hours support for Cacti !
Updates to CereusTransporter coming for InfluxDB integration
CereusTransporter is a plugin for Cacti which allows you to send Cacti data to InfluxDB for further processing. You can use the data to create Dashboards in Grafana or analyse the data with machine learning techniques to identify anomalies within your network.
During the upcoming weeks, CereusTransporter will get some fresh updates and features implemented.
These include:
- Support for adding custom tagging
- Token based authentication for InfluxDB
- Filtering of data sources to be send
Get in touch with us to get your ideas in !
DSGVO – New Registration required
Please note that we have deleted any registered users to start with a clean userbase after the go-live of the DSGVO in Europe.

New HealthCheck service available for your Cacti system
Urban-Software.de is pleased to announce a new HealthCheck service offering for your Cacti system.
The new HealthCheck server provides you to with an in-depth analysis of your system and delivers recommendations and guidelines to improve your Cacti monitoring solution.

NEW Cacti Beginners Guide Book for Cacti Version 1.0
My new book is finally released. It’s a complete re-write to Cacti 1.x
New project: phpIP Update !
A new project has been started based on the phpIP software which the nmidPhpIP plugin was based on.
The goal of this new project is to update phpIP for PDO, some better seurity and an updated user interface. The source will be released under the GPLv2 and is hosted here:
CereusReporting 3.01 has been released !
As of today, CereusReporting for Cacti 3.01 has been released. This version enables Cacti 1.x.x support.
Look here for some screenshots and a feature list: https://www.urban-software.com/products/cereusreporting-professional-pdf-reports-for-cacti/