CereusTransporter Plugin Now Supports Elasticsearch 8 and Elastic Cloud 8!
🌟 Exciting Update: CereusTransporter Plugin Now Supports Elasticsearch 8 and Elastic Cloud 8! 🌟
Calling all Cacti users! We’re thrilled to announce an important update to the already amazing #CereusTransporter plugin! 🌵🚀
You’ve experienced how effortlessly CereusTransporter sends your Cacti data to popular tools like #Boson and #InfluxDB. We’ve expanded its functionality to support #Elasticsearch and #ElasticCloud! This update will elevate your data analytics and monitoring capabilities to new heights.
🔗 CereusTransporter Enhanced Features:
1️⃣ Expanded Compatibility: Besides Boson and InfluxDB, CereusTransporter now seamlessly integrates with Elasticsearch and Elastic Cloud, ensuring smooth data transfer and integration.
2️⃣ Improved Analytics: With Elasticsearch and Elastic Cloud support, you can unlock even more potential from your Cacti data by leveraging advanced analytics and visualization features.
📣 Calling Testers: We’re looking for enthusiastic testers to help us ensure that the new features of CereusTransporter work flawlessly! If you’re a Cacti user eager to contribute to the plugin’s development, join our test group and enjoy early access to the enhanced features while sharing your valuable feedback.
🔗 Connect with us on LinkedId and get in touch to join our test group or to learn more about the updated CereusTransporter plugin!
Release of Cacti version 1.2.24
🚀The latest release of Cacti, version 1.2.24, comes with numerous improvements, bug fixes, and compatibility enhancements.
Here are some key highlights:
🔧 Fixes in template import, device management, and database operations.
🌐 Compatibility updates for PHP 8.2, Debian ‘bookworm’ systems, and various themes.
🛠️ Enhancements to SNMP settings, plugin permissions, and remote data collectors.
🌟 Improved user experience, including better translation handling, error logging, and interface updates.
This update addresses a wide range of issues, from template handling to database management, ensuring a more stable and efficient monitoring environment. By upgrading to Cacti 1.2.24, users can enjoy a smoother and more reliable experience, benefiting from the numerous fixes and improvements in this release.
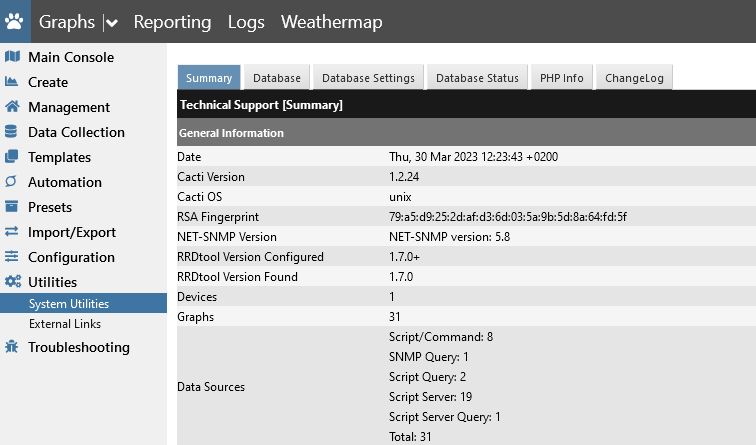
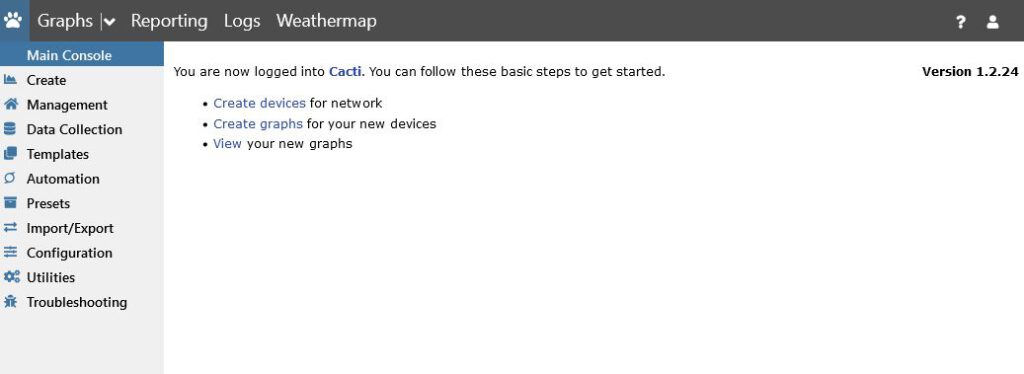
Make sure to update your Cacti installation and take advantage of these enhancements! 🎉
Visit the Cacti site and download the latest copy: https://www.cacti.net/
Make sure to contact us for your support requirements !
CereusTransporter 1.0 has been released!
Exciting news for all Cacti users!
I am thrilled to announce the release of the CereusTransporter 1.0 plugin for Cacti. This powerful plugin lets you easily send data from Cacti to InfluxDB2 for advanced monitoring and analysis.
With CereusTransporter, you can easily monitor and analyze data from multiple sources in near real-time, giving you a complete picture of your network performance.
Built Dashboards in Grafana, or use Machine Language to identify issues before they occur.
If you need support or have any questions about the CereusTransporter plugin, please contact us.
Download the plugin today and take your network monitoring to the next level!
CereusTransporter for Cacti supports InfluxDB2
CereusTransporter for Cacti now supports InfluxDB2 and token-based authentication. Data from Cacti can now be sent to InfluxDB2, a time series platform where you can collect and store long-term data from multiple sources.
CereusTransporter is a plugin for Cacti that can send data to databases or platforms like Bosun, InfluxDB1/InfluxDB2, or OpenTSDB. The Cacti data then can be further processed to create Dashboards, integrated into existing alarm tools, or just kept for BigData analysis.
The upcoming release of CereusTransporter 1.x will add InfluxDB2 support. Future versions add the ability to define custom tags, filter data to be sent, and specify multiple target platforms.
Look here for the plugin page: CereusTransporter
If you need commercial support with your Cacti installation, Contact us today !
NEW Cacti Beginners Guide Book for Cacti Version 1.0
My new book is finally released. It’s a complete re-write to Cacti 1.x
Closed BETA for CereusReporting 3.01 for Cacti 1.x has started !
The closed BETA for CeruesReporting 3.01 which is compatible with Cacti 1.x has started. You can participate by ordering the free BETA product from here.
The BETA slots are limited.
CereusReporting Personal available
A new CereusReporting Personal edition of CereusReporting for Home users is now available. It has the full features of the Professional edition (limited to 1 server) and can be used for non-commercial use.
Look here for more information:
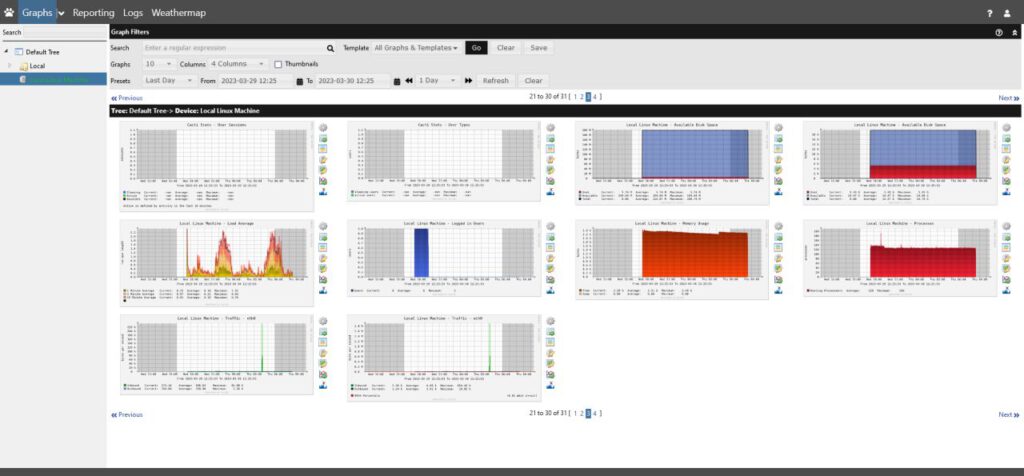
Monitor Linux Server with Cacti – Part 1
In this little HowTo series “Monitor Linux Server with Cacti” we are going to look into configuring a Linux server to be monitored by Cacti and how to create the graphs within Cacti itself.
CereusAgent Updates
Installing InfluxDB on CentOS 7
A new InfluxDB on CentOS HowTo has been created, describing the installation steps required to get a new influxdb instance running on a CentOS 7 based system.

