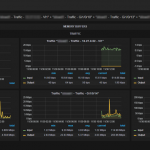
Visualizing Cacti Data with Grafana and InfluxDB
Introduction
Cacti has a great polling engine for retrieving SNMP, WMI and other data from a lot of different devices. It generally stores the data into RRD files which are then being used to create the actual graphs for the users to view. By using InfluxDB together with Grafana as a frontend, it is possible to built an easy to use performent dashboard for end-users utilizing the Cacti polling engine.

